Projects / Fornax A
Fornax A: exploring writing galaxy simulations in C
Personal project, 2026 · N-body code written from scratch in C with OpenMP · set-up and analysis in Python
NGC 1316 is the brightest galaxy in the Fornax cluster and the host of the radio source Fornax A. Its outskirts are full of merger debris: stellar loops and shells out to about 160 kpc (Iodice et al. 2017) and neutral-hydrogen tails 70–150 kpc long (Serra et al. 2019). Serra et al. argue that it formed in a roughly 10:1 merger, 1–3 Gyr ago, between a gas-poor lenticular galaxy and a gas-rich spiral like the Milky Way. I built a collisionless N-body model of that scenario, set up from the literature, to see how much of what we observe it can reproduce.
The model
| Primary (lenticular) | Satellite (Milky Way-like spiral) | |
|---|---|---|
| Dark halo | 4.5×10¹² M☉ | 6.1×10¹¹ M☉ |
| Bulge | 4.8×10¹¹ M☉, rotating | 10¹⁰ M☉ |
| Stellar disk | 1.2×10¹¹ M☉ | 5×10¹⁰ M☉ |
| Cold gas | none | 10¹⁰ M☉ (tracer) |
| Particles | 660 000 | 475 000 |
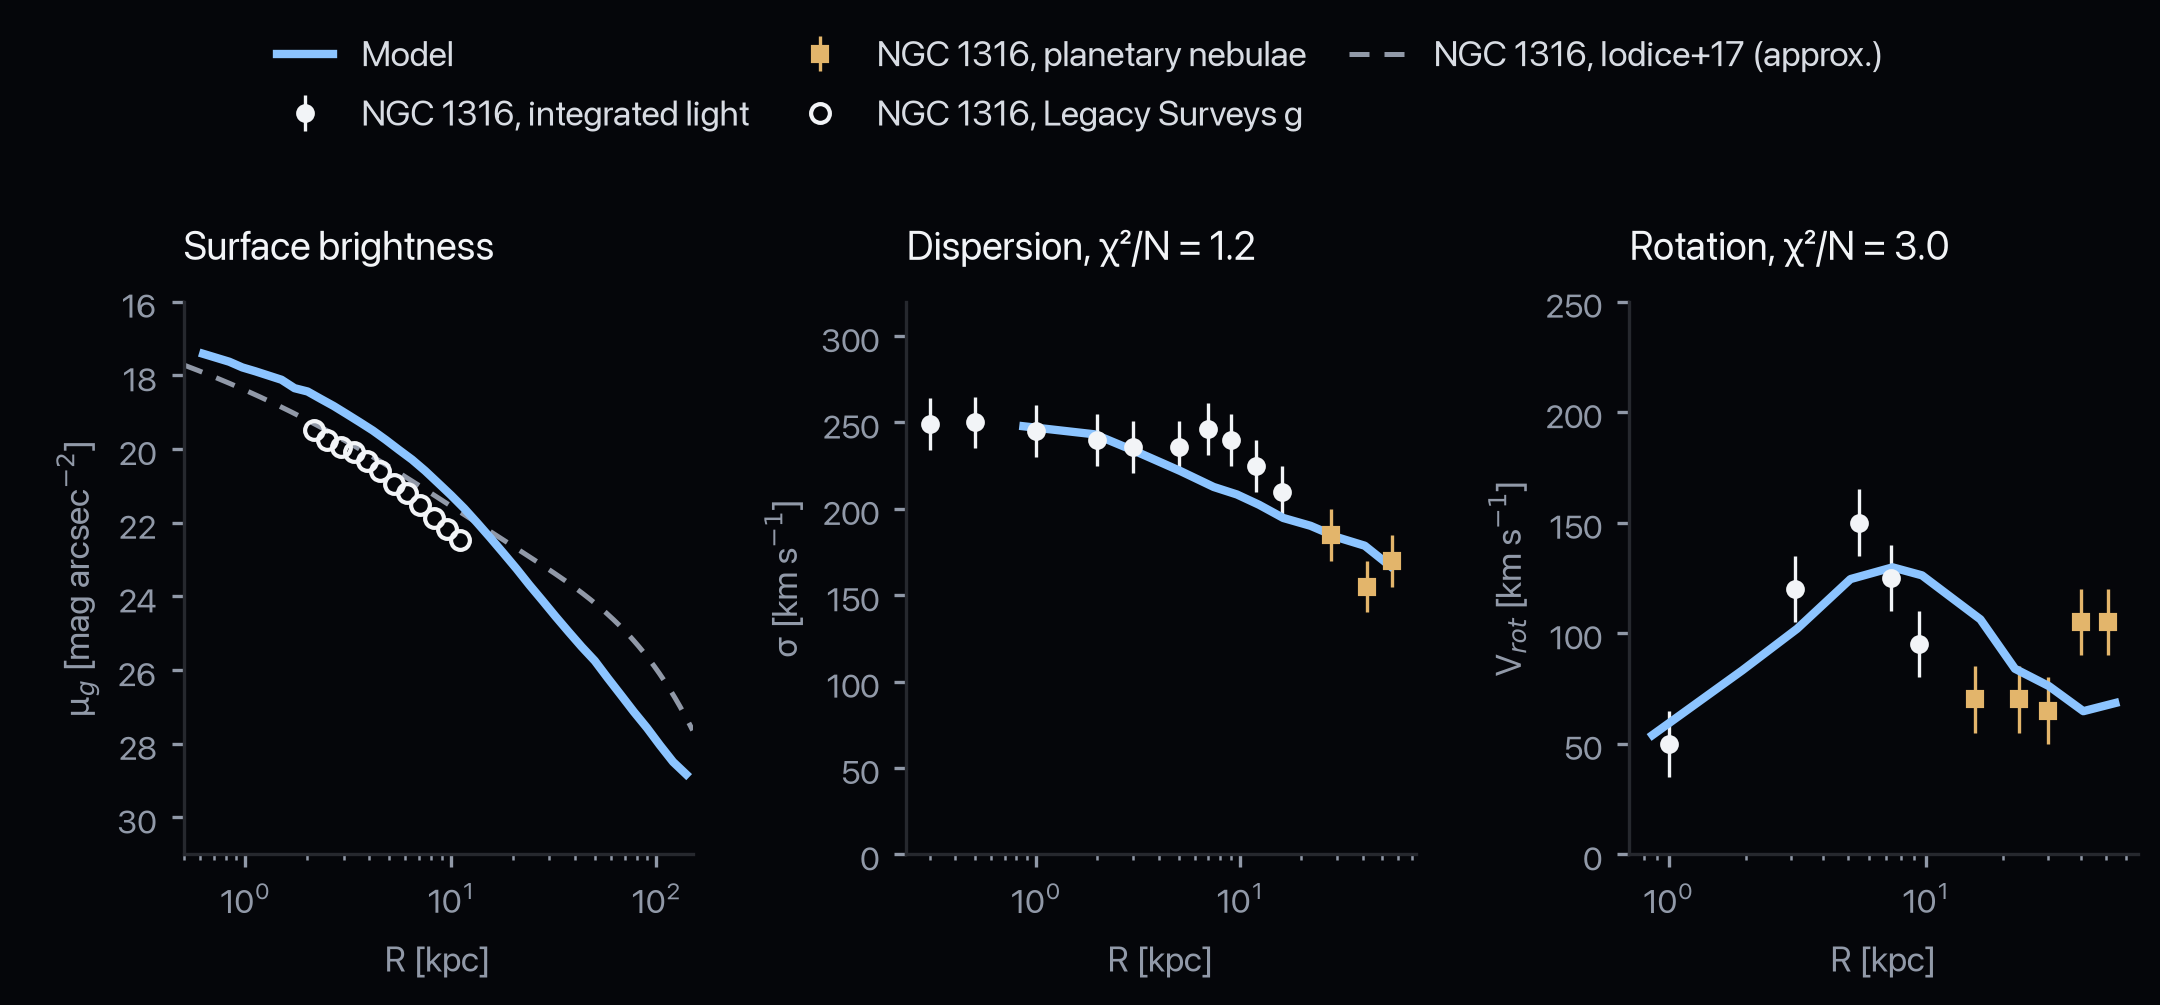
The stellar mass ratio is 10.3:1. I calibrated the primary by fitting the observed velocity-dispersion profile of NGC 1316 (McNeil-Moylan et al. 2012), keeping its stellar mass within the photometric range of Iodice et al. (2017); the adopted model reproduces σ(R) from 1 to 50 kpc. Each galaxy was then evolved on its own for 0.6–1 Gyr to check that it was in equilibrium before the two were put on a collision course. Over 1 Gyr in isolation, the primary's Lagrangian radii drifted by at most 3.7% and its energy was conserved to 3 parts in 10⁴.
The code
The simulation runs on a collisionless N-body code I wrote from scratch as a single C11 file. Gravity uses a Barnes–Hut octree with quadrupole moments and the Barnes (1994) offset opening criterion, softened on 100 pc scales. Particles advance with a kick–drift–kick leapfrog on individual block timesteps, and the force calculation is parallelised with OpenMP. The code comes with a validation suite that checks it against problems with known answers, such as the equilibrium of a Plummer sphere and cold collapse. The production run followed 1.135 million particles for 3 Gyr and wrote a snapshot every 5 Myr. Python scripts build the initial conditions and handle the analysis and rendering.
Choosing the orbit
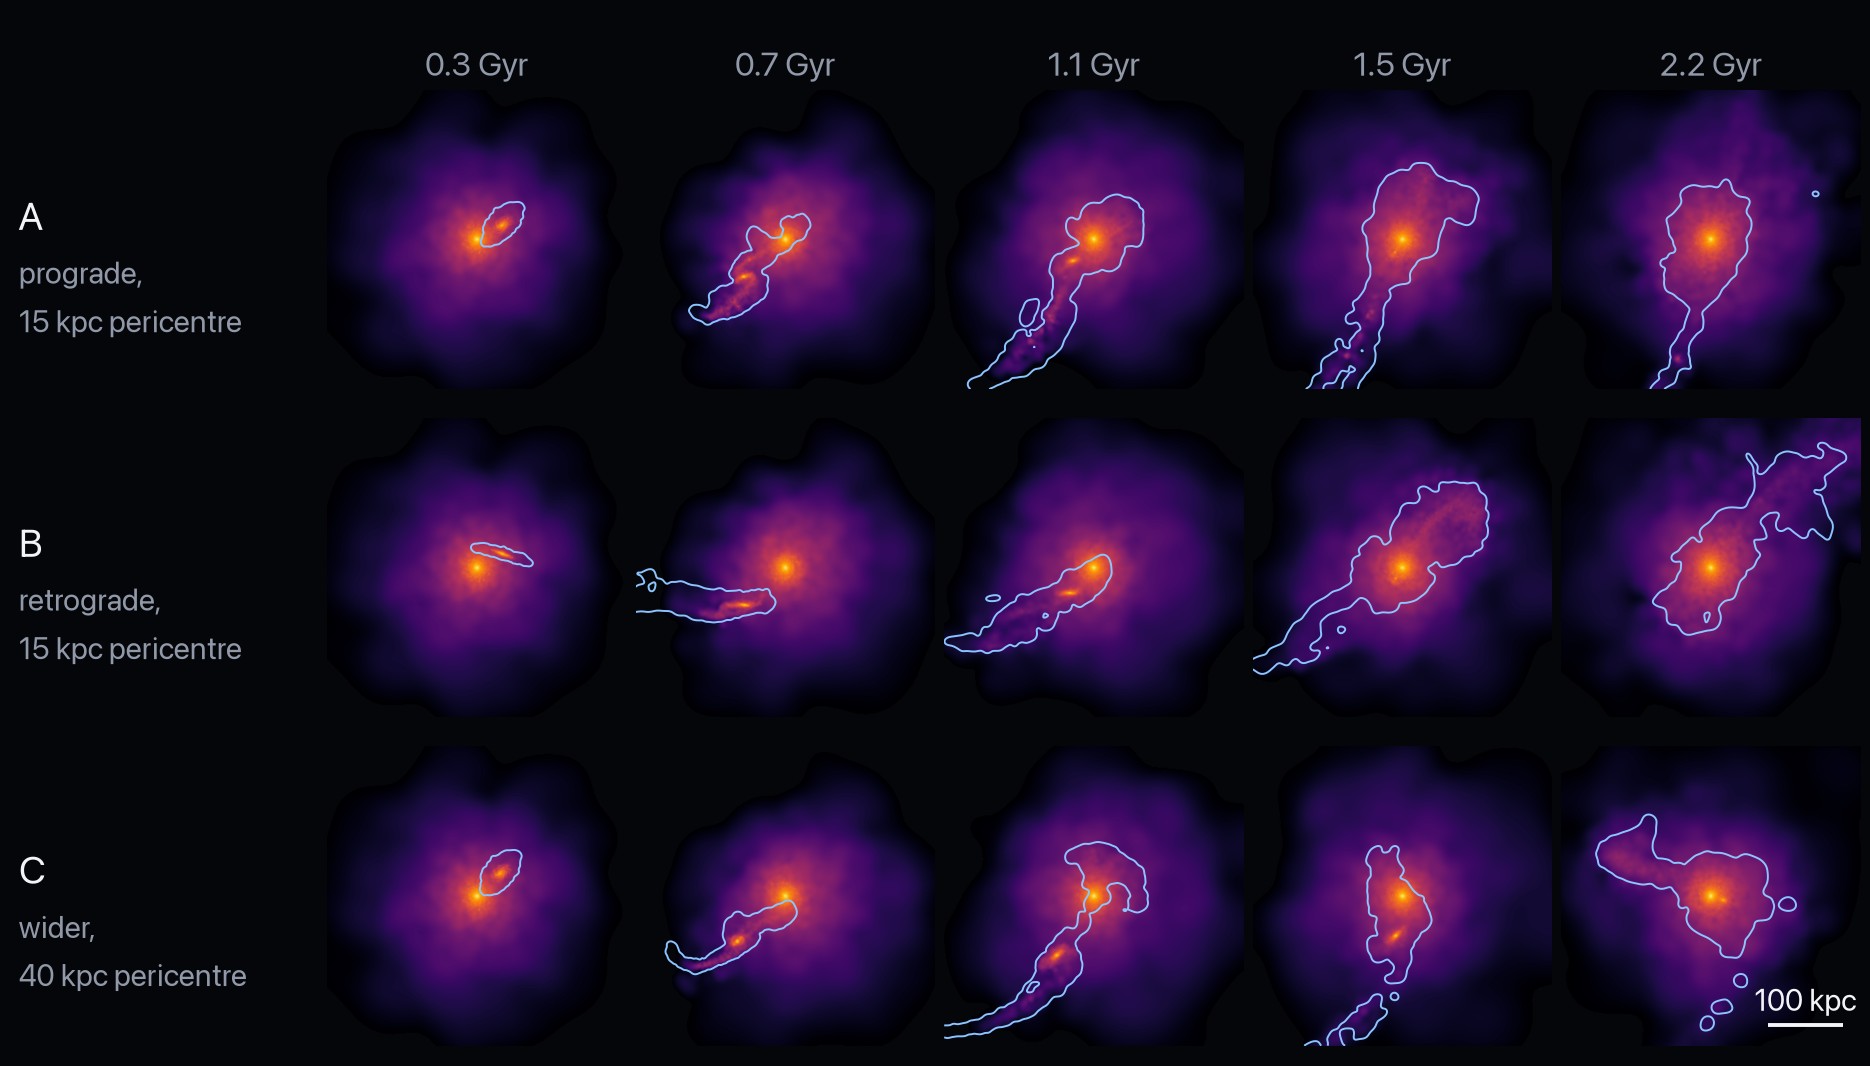
Before the production run, three low-resolution scout mergers (91 000 particles, 2.2 Gyr) tested a prograde passage at 15 kpc (A), the same orbit retrograde (B) and a wider 40 kpc pericentre (C). I chose A because the prograde passage tears out the long, thin tidal tails that the HI shows. B spreads the debris into a broad fan instead, and C needs more passages before it merges.
What happens
| Time | |
|---|---|
| 0.36 Gyr | First pericentre at 11 kpc: a tidal tail and the first shells are thrown out |
| 0.75 Gyr | Apocentre at 116 kpc |
| 1.20 Gyr | Second pericentre, 0.5 kpc |
| 1.4–1.9 Gyr | The orbit decays through apocentres of 30, 18 and 15 kpc |
| 1.67 Gyr | The satellite's bound core falls below 10% of its bulge mass |
| ≈ 2.0 Gyr | The two nuclei coalesce |
| 3.00 Gyr | End of the run: a remnant about 1 Gyr past the merger |
Comparing with NGC 1316
The final remnant is about 1 Gyr past the merger, at the young end of the 1–3 Gyr age that Serra et al. infer. To compare it with the real galaxy, I rendered it from the direction that best matches the observed kinematics, at the same physical scale, orientation and surface-brightness scale as an image of NGC 1316 from the DESI Legacy Imaging Surveys, taking a distance of 20.8 Mpc.
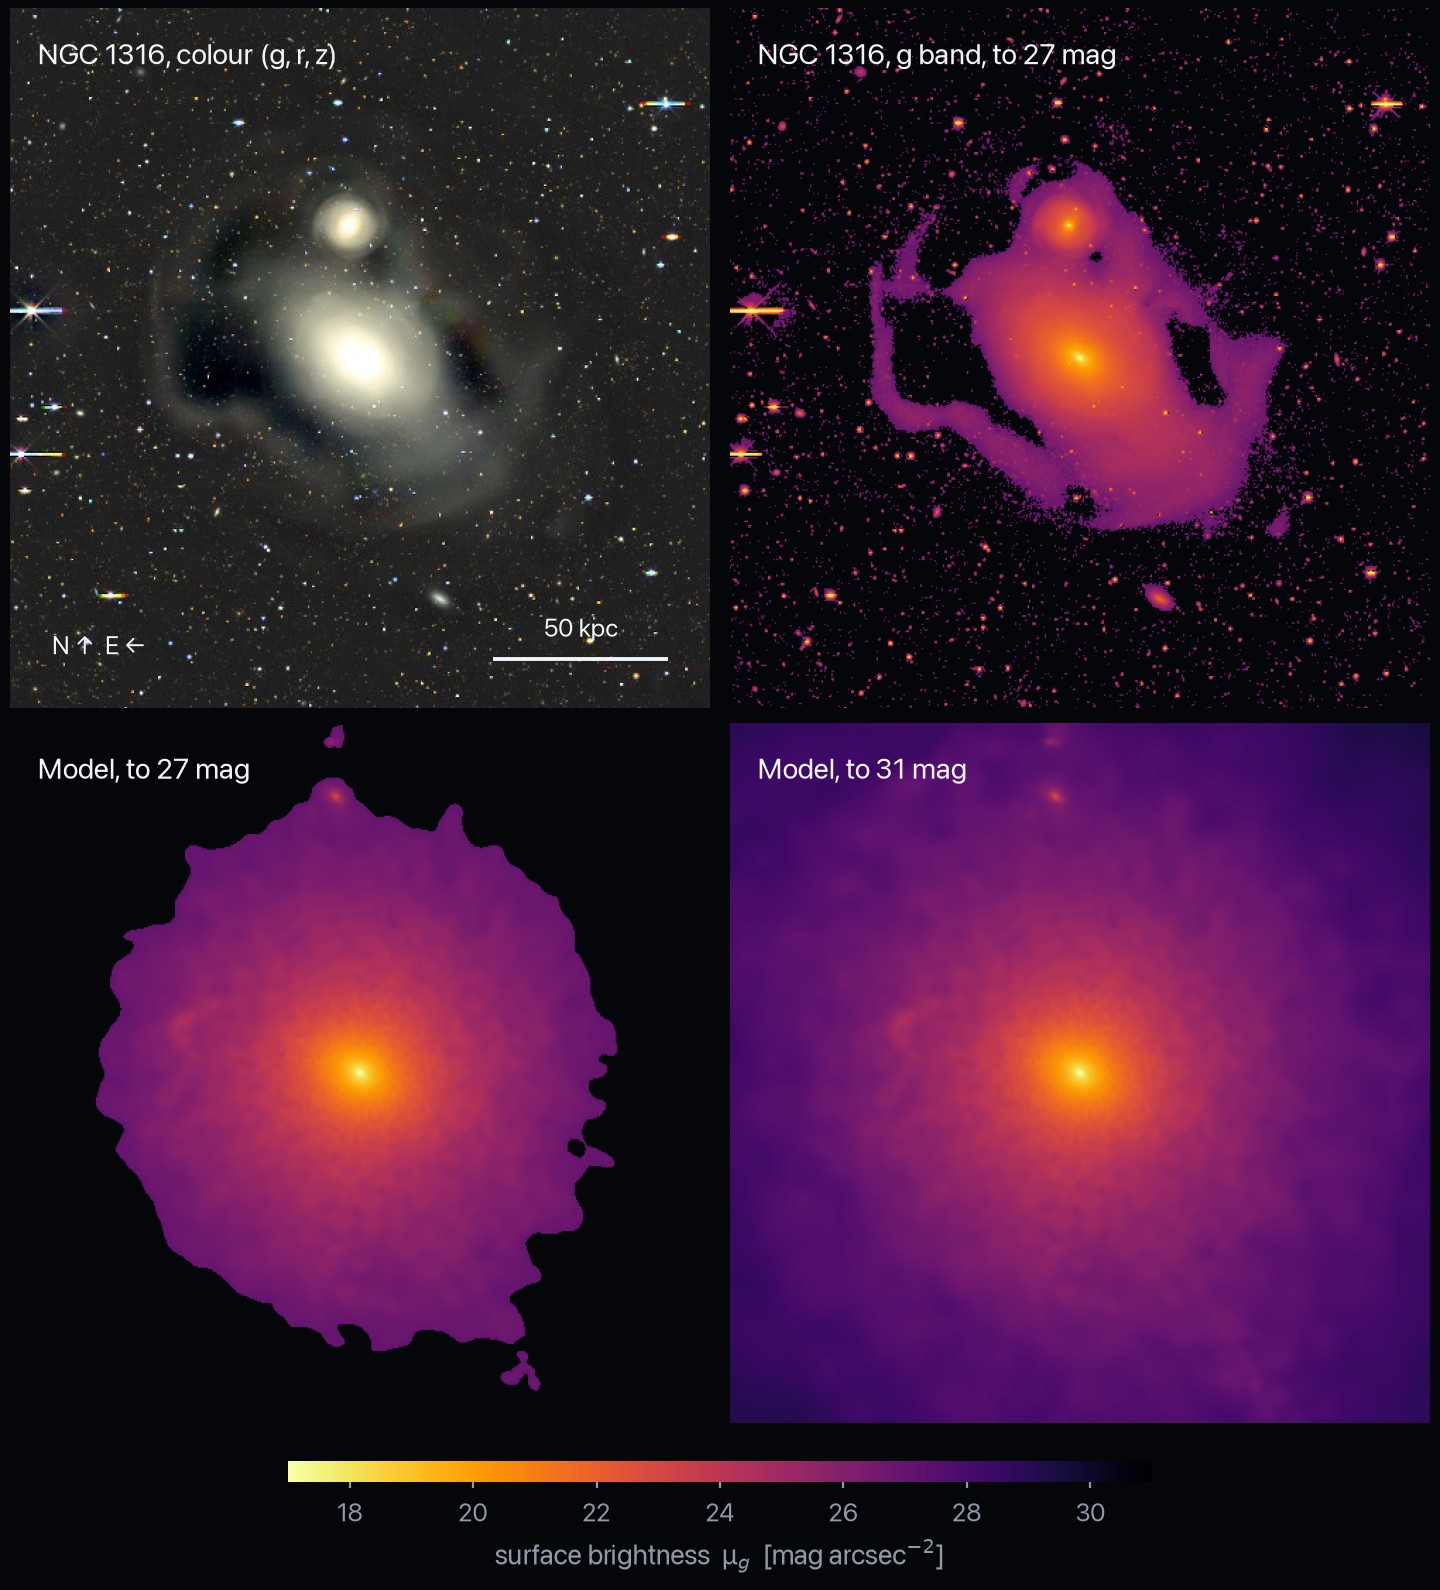
At the same depth the model is about the right size, but it is rounder and smoother than NGC 1316, which has dust lanes (there is no dust in the model) and loops of debris visible even in this survey image. The radial profiles are a more quantitative test. The model reproduces the velocity-dispersion profile well (χ²/N = 1.2) and the rotation curve less well (χ²/N = 3.0). Its surface brightness is slightly too high inside 10 kpc and too low beyond about 20 kpc, so it lacks part of the real galaxy's extended envelope.
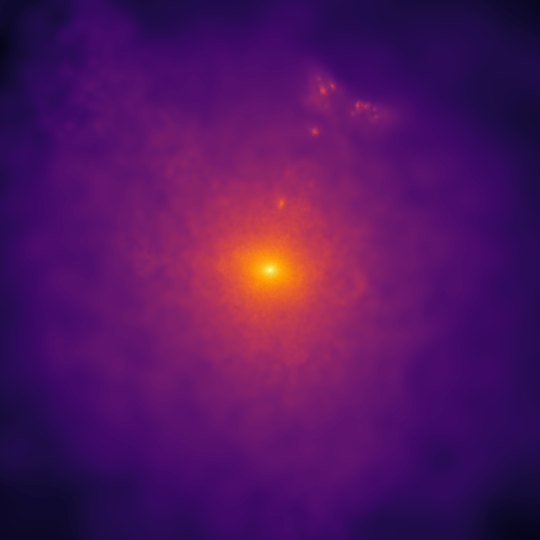
Stripped stars pile up into a shell system that is strongest around 1.8 Gyr, with shells at radii similar to NGC 1316's loops (about 91 and 160 kpc). That agreement says the orbital energy is about right, not that the model predicts where on the sky each loop should be.
One moment, six quantities
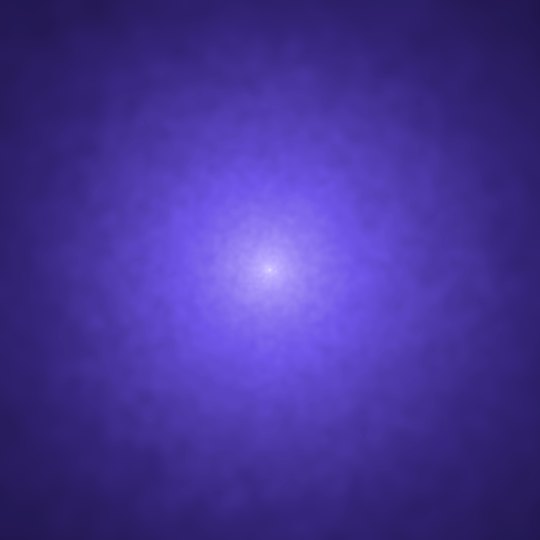
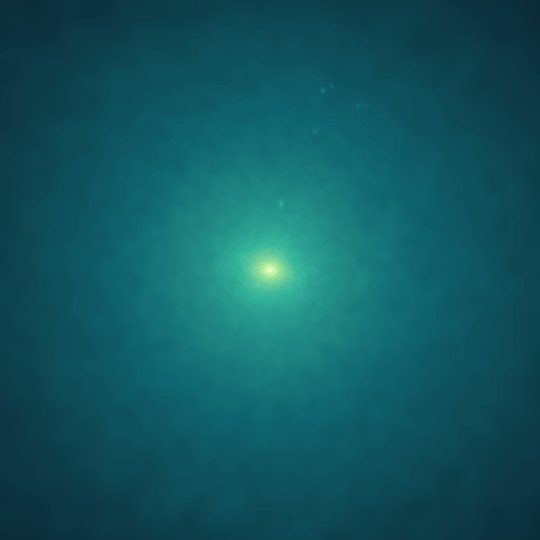
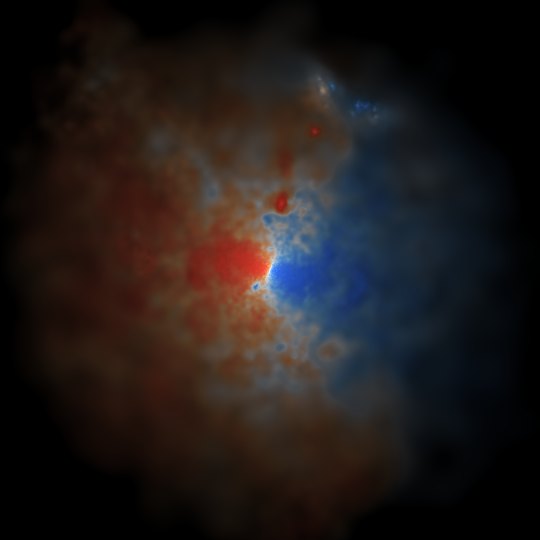
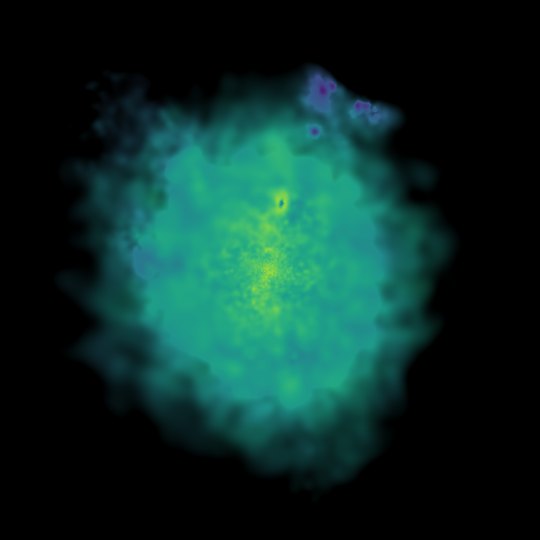
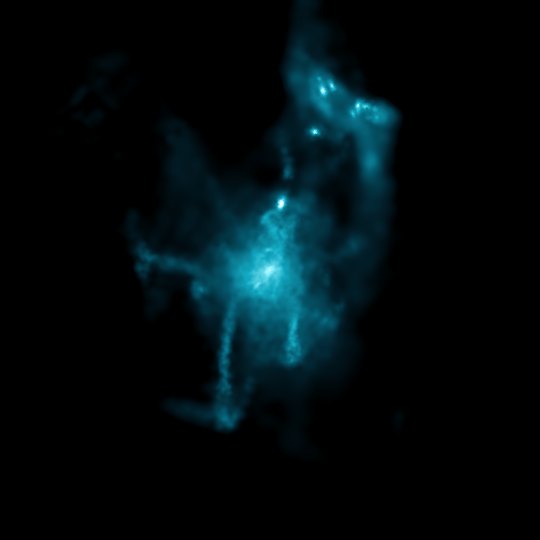
Every quantity is rendered as its own frame series. These show the central 250 kpc at 1.8 Gyr, when the shells are strongest.
Limitations
- No gas physics. The "gas" is a collisionless tracer that moves only under gravity. Real HI tails fade as gas is stripped, ionised and turned into stars, so the tracer's tails keep growing: past the observed 70–150 kpc by about 2 Gyr and out to 206 kpc by 3 Gyr. It also leaves far too much cold gas behind (8.4×10⁹ M☉ beyond 20 kpc, against about 7×10⁸ M☉ of HI observed). There is no star formation, dust or AGN, so the model says nothing about the radio lobes.
- One merger, in isolation. There is no Fornax cluster potential, no neighbouring NGC 1317 and no later minor accretion.
- A scenario, not a fit. The masses are calibrated, but the orbit was picked from three candidates by eye rather than found by a search over orbital parameters.
- Finite resolution. Features smaller than about 0.3 kpc are not resolved, and the heavy dark-matter particles slowly heat thin structures.
Code
The N-body code and the analysis scripts will be on GitHub soon.
References
- Barnes, J. E. 1994, in Computational Astrophysics: offset opening criterion
- Dey, A. et al. 2019, AJ, 157, 168: the DESI Legacy Imaging Surveys, source of the NGC 1316 images (legacysurvey.org)
- Hernquist, L. 1993, ApJS, 86, 389: N-body realisations of disk galaxies
- Iodice, E. et al. 2017, ApJ, 839, 21: deep VST imaging of the loops and envelope
- McNeil-Moylan, E. K. et al. 2012, A&A, 539, A11: planetary-nebula and integrated-light kinematics
- Power, C. et al. 2003, MNRAS, 338, 14: timestep criterion
- Serra, P. et al. 2019, A&A, 628, A122: MeerKAT HI tails and the merger scenario