Projects / Overhead
Overhead: print the sky from any moment
2026 · JavaScript, runs entirely in the browser · MIT licence · try it
Overhead turns a date, time and place into the sky that was overhead, and gives you a print-ready vector PDF of it. It makes three things: a poster to frame, a planisphere, and a chart of the sky for a single night.
Star maps like these are usually sold as posters. The astronomy behind them is well established and the data is public, so I wrote a tool that makes them for free. Everything runs in the browser: there is no backend, no account, and nothing is uploaded.
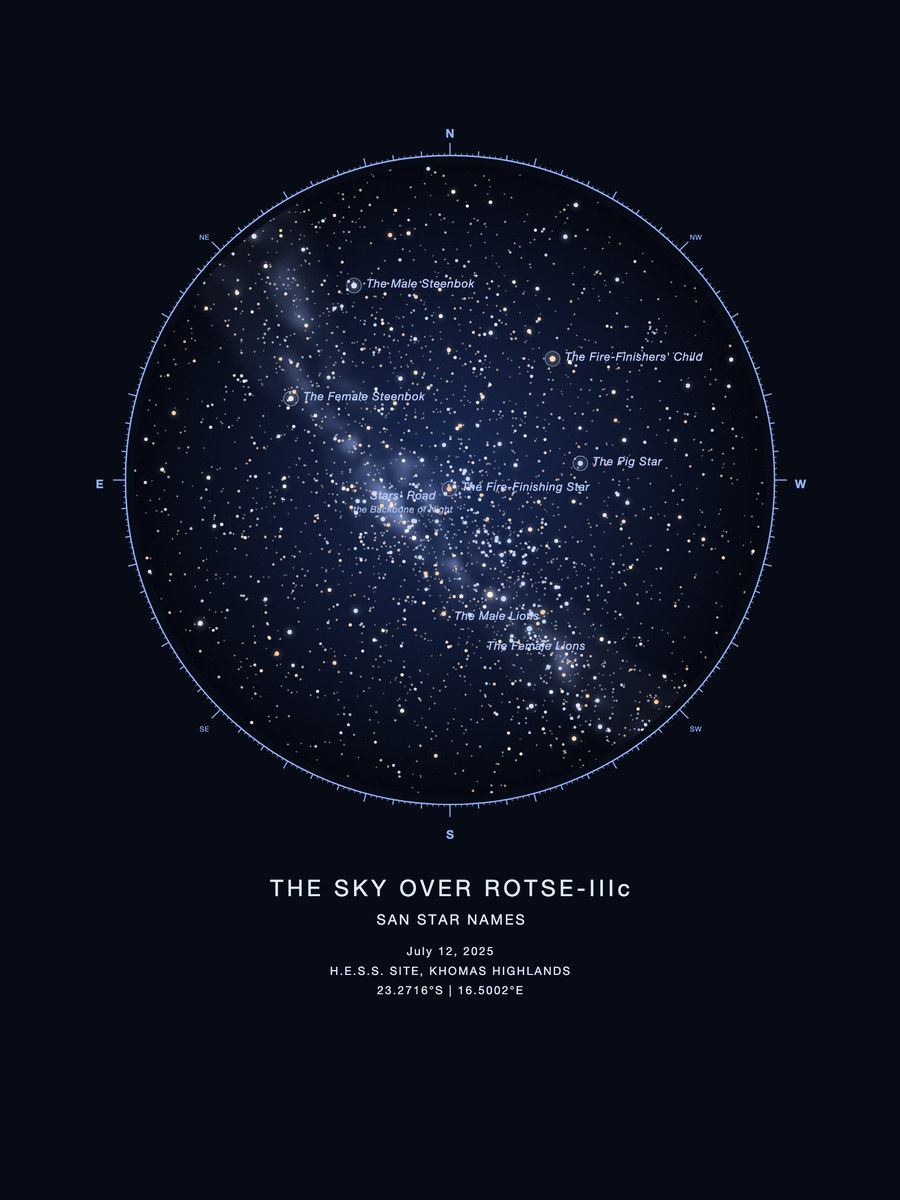
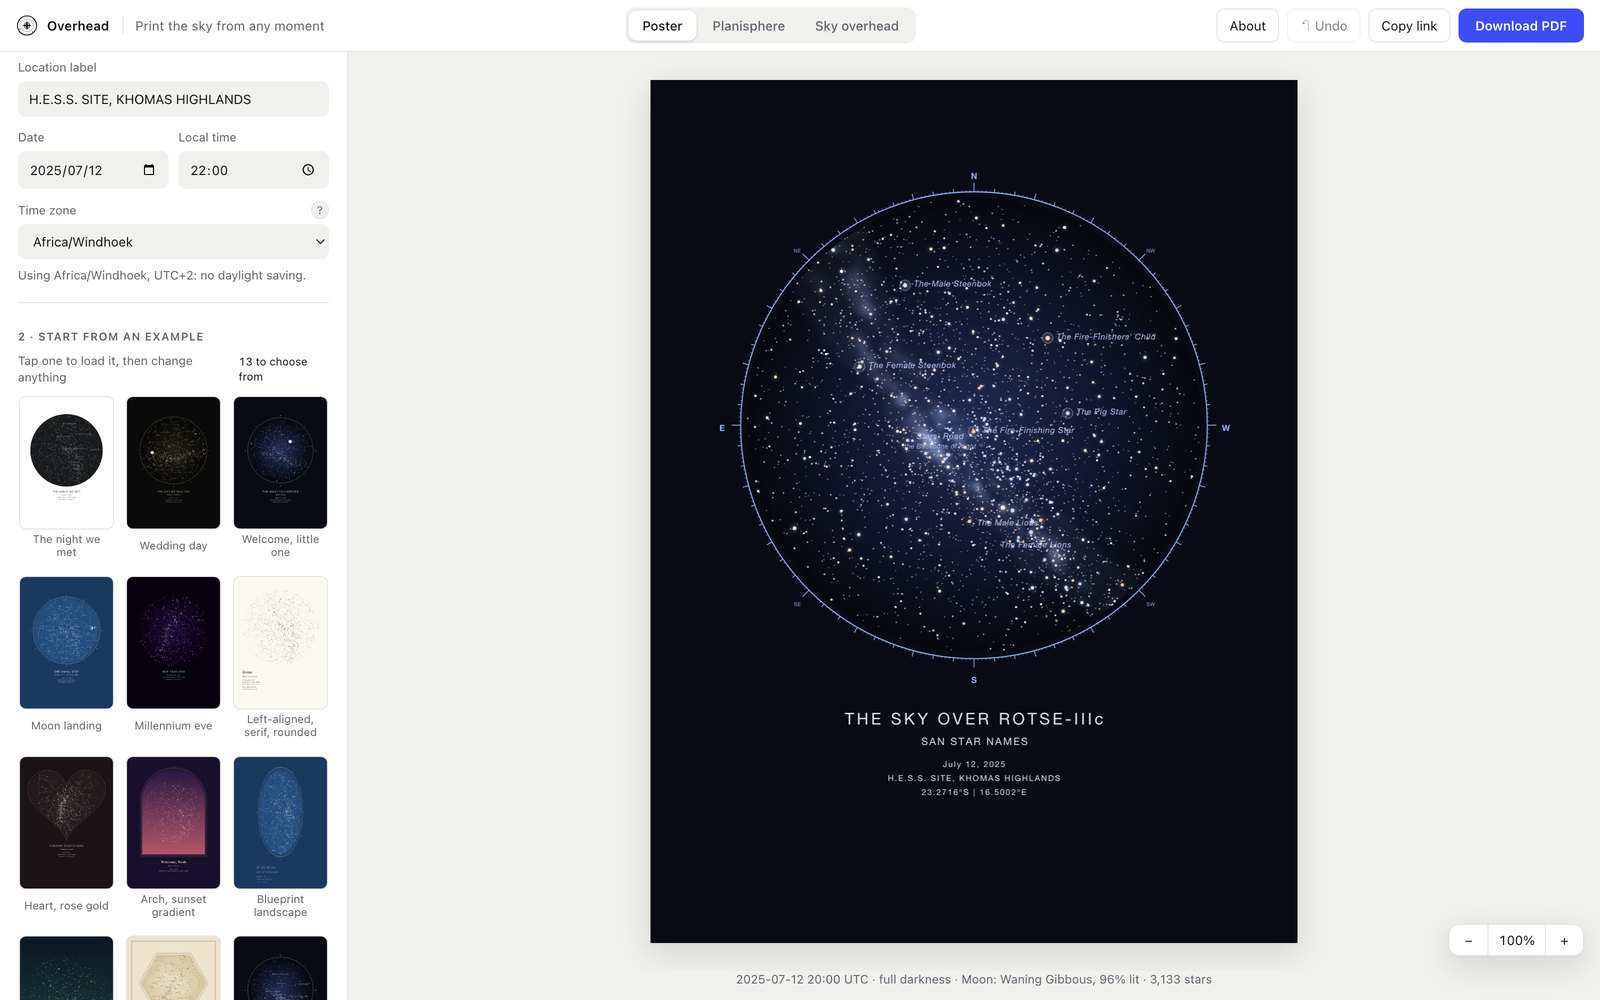
What it makes
Posters come in 11 themes with full colour control, seven shapes (circle, rounded square, square, arch, hexagon, heart or the whole page), 18 paper sizes, and your own fonts if you want them.
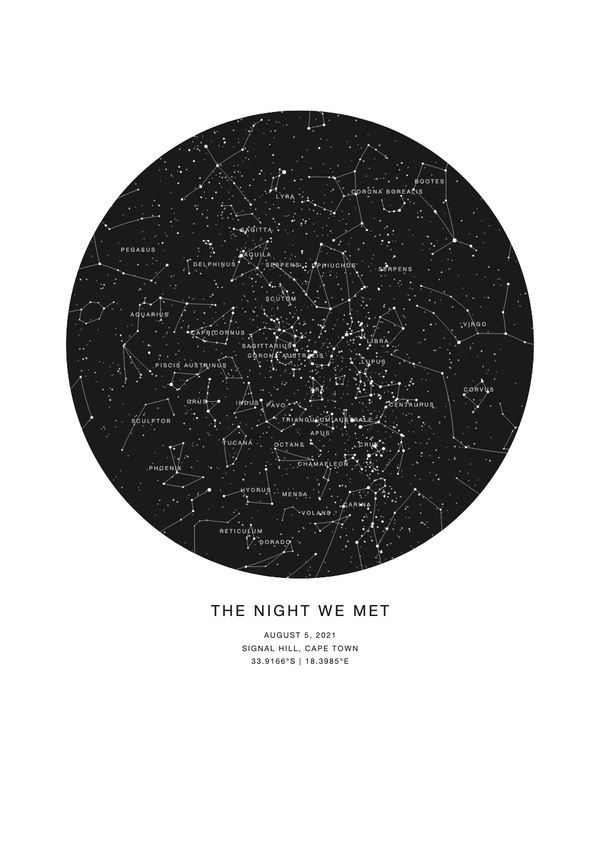
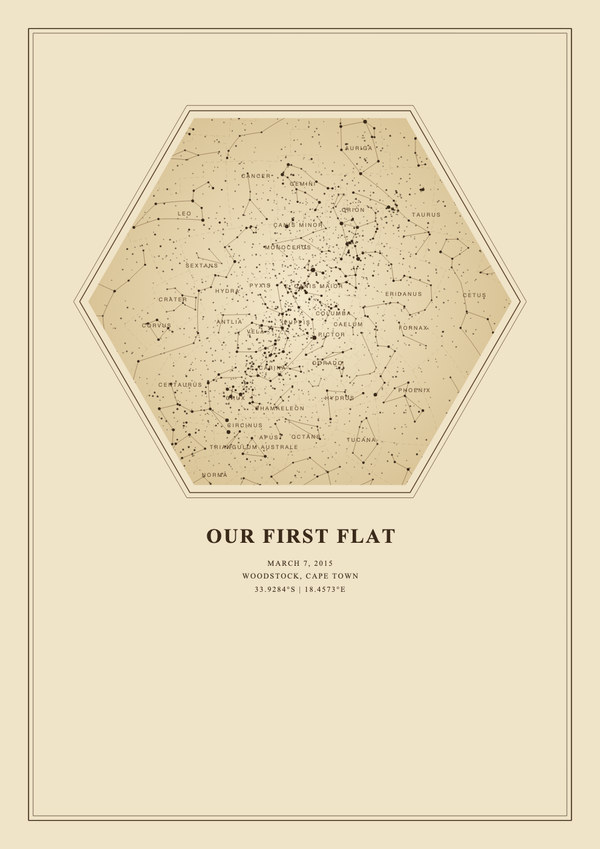
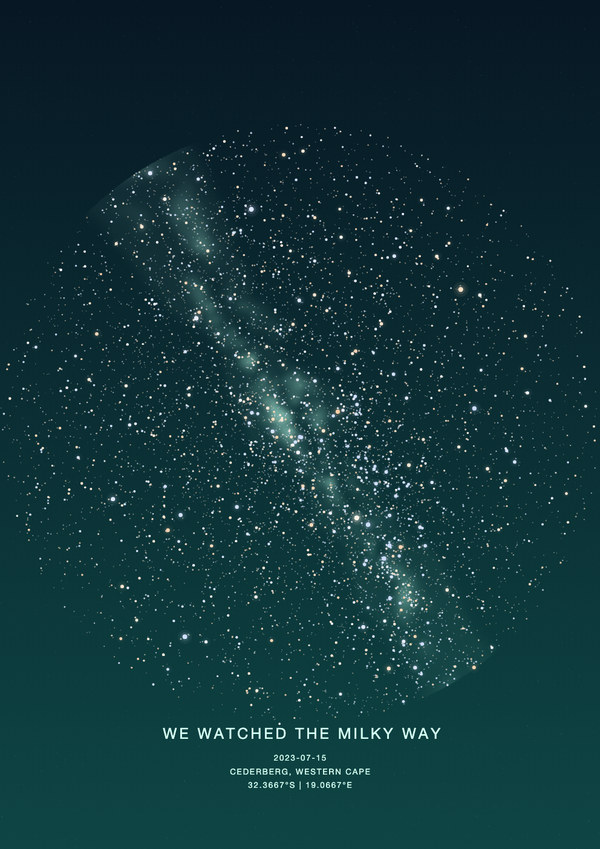
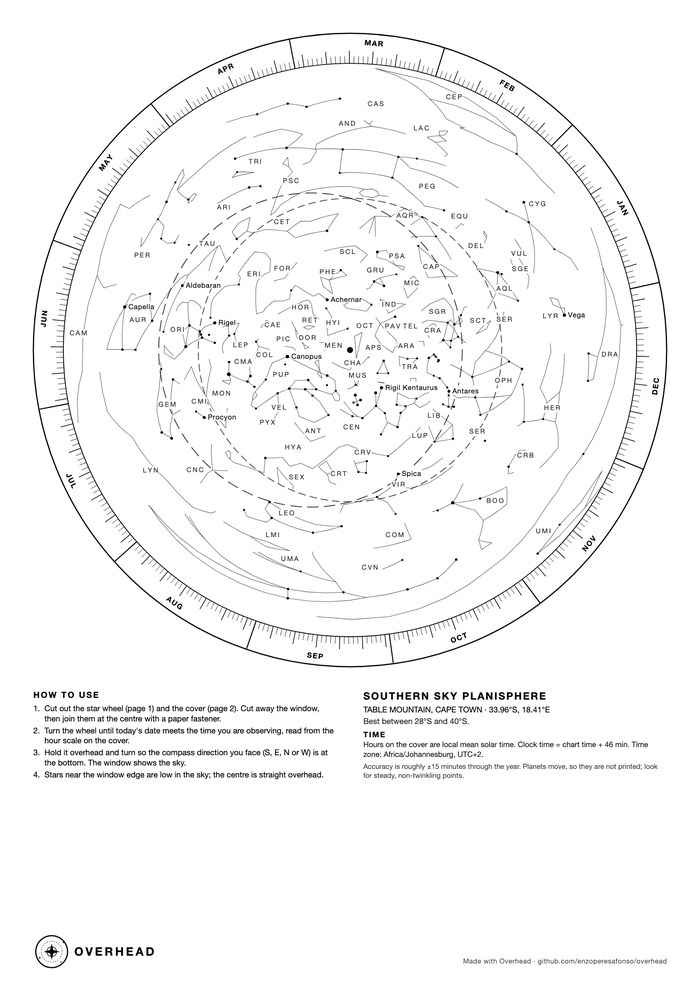
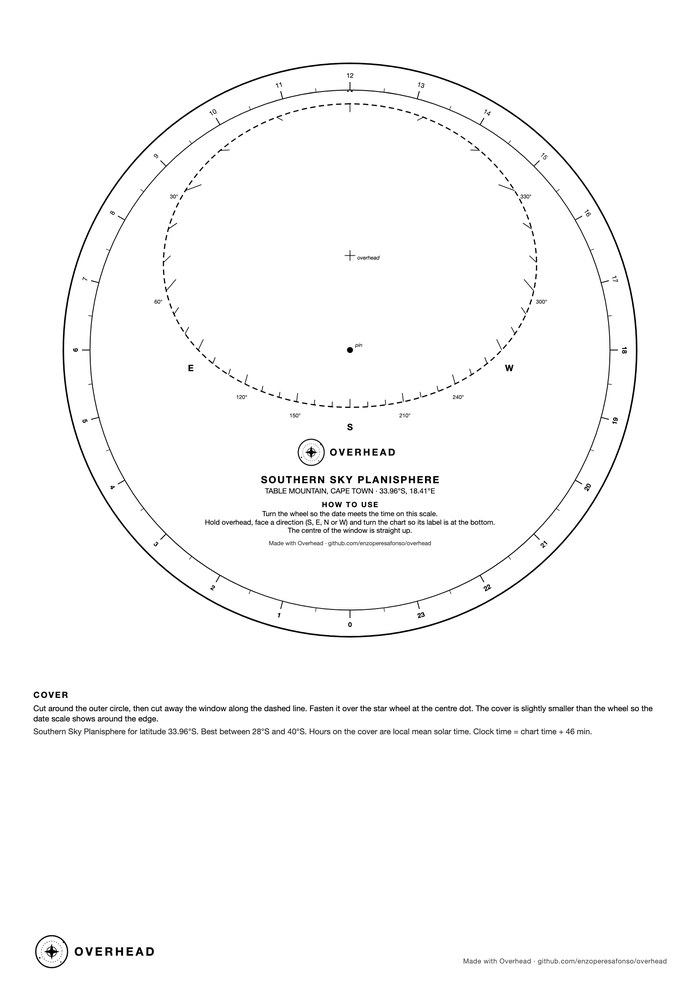
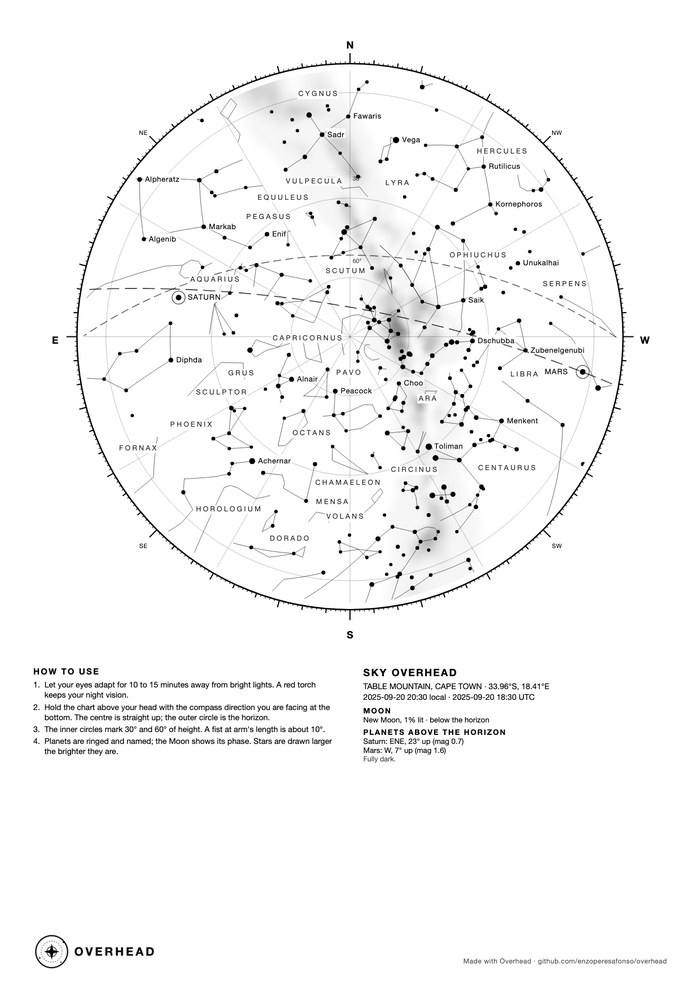
The other two are working charts rather than decorations, so they print black on white:
- A planisphere: a star wheel and a cover with a horizon window. Cut both out, pin them together, and turn the wheel to any date and time to see what is up. It is built for your latitude, and it tells you the correction between clock time and the chart. Open the Cape Town one.
- A sky-overhead chart for one date, time and place: a compass ring, altitude circles, the Moon's phase and the planets above the horizon, with instructions for holding it over your head and matching it to the sky.
The sky it draws
The sky is the real one for that moment: precession, the planets, the Sun, the Moon with its phase, and the Milky Way, down to whatever limiting magnitude you choose. A "naked eye only" setting drops it to what someone could actually have seen: stars to magnitude 6, the brighter deep-sky objects and the five visible planets.
There is also a set of Southern African star names, from San, Khoikhoi, Xhosa, Zulu and Swazi, and Sotho, Tswana and Venda traditions, which can be printed instead of the Latin constellations. Names, spellings and meanings vary between communities and over time, so what is in Overhead is a small sample drawn from published ethnoastronomy rather than a catalogue, and corrections are very welcome. I wanted it there because the sky I grew up under has been read and named here for a long time, and Orion and Scorpius are only one way of doing it.
How it works
Overhead is plain static files, ES modules with no build step, so it will run from any web server or straight off your own machine. Star, constellation, Milky Way and deep-sky data come from d3-celestial (Hipparcos-derived), planet positions use Paul Schlyter's low-precision method, and the PDF is written by jsPDF so the output is true vector rather than a picture of a chart. Stars fainter than magnitude 6 are a megabyte of data, so they only load if you ask for them.
The only thing that ever leaves your browser is the text you type into the place search, which goes to Open-Meteo to turn a place name into coordinates. If you'd rather it didn't, type the coordinates yourself.
Try it
- Make a star map in the browser, or open one of the designs above and change it.
- Source on GitHub, MIT licensed. The bundled data and libraries keep their own licences.